
The purpose of this project was to create for parents a technologically extra advanced tool for tracking their children’s progress in any educational afterschool activities that they attend, such as music lessons, mathematical clubs, sports clubs, foreign languages lessons etc.
We wanted to use A.I. ( or rather a learning machine ) to pursue their progress and growth, analyze it and present the scores in beautiful infographics, graphs and charts. Furthermore, it would suggest new challenges and activities that suit the children better, based on the data collected.
It was supposed to help the parents, save their time and assure them, they are making the right choice for their kids to help them grow, that their children are using their potential in 100% and improve it from an early age.
First, we wanted to test the idea and find out how to accomplish it, so we conducted interviews with parents that have children aged between 6 and 15 y.o. We wanted to know, what is the best way to meet their needs.
It took us a lot of time and effort to organize the interviews, prepare the right questions, run the pre-screener, analyze gatherings and choose parents for interviews.


Surprisingly we found out, that parents are not interested in a detailed analysis of their children’s progress, especially they don’t want to decipher any graphs or other data representations. Moreover, the suggestions about their children’s future interests or activities didn’t seem useful for them. They know their children very well and they know their needs and interests.
As you can see our idea was a bummer...

Fortunately, we learned what their actual needs were just in time, which gave us new hope and inspiration to create something different, a tool that’s gonna solve their actual problems.

Based on the responses received, we learned that what the parents care, is their children’s satisfaction from after-school activities.

We also learned about many other needs and difficulties that they meet when it comes to finding the right place for their kids to learn and have fun. It was important to us, to analyse all the information and empathetic data gathered to set our new goals.
Long story short, at this stage we used two methods to specify new goals: empathetic data analysis to gather and specify users needs and difficulties, then visual thinking method for ideation, to define what problems we can solve with this new platform, what values we can bring in.
Using all the information from interviews we were able to define target users profiles and emphasise their pain points.
Based on our research, we recognised that there was one main user type that we decided to focus on and deliver solutions for.
View presentation
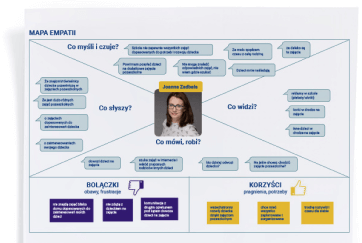
We specified users difficulties and needs. It helped us to understand them better.
View presentationTo understand every step of the process of searching and selecting educational after-school activities, we made a visualisation of every task during this process. This task model showed as many possibilities.
View presentation

We also established how they find information about places they can send their children after schooll.
View presentationUltimately, this platform will be
something different than we assumed.
We wanted to make this process fast and as easiest as possible, so we decided that controlled brainstorming will help us to define solutions that meet the parent’s needs. We used the Visual Thinking method in a three-person team. We had so many ideas that we made voting with cards to choose the ones that we can actually provide.


Joanna needs to find the right places for her children that are close to a specific location, for ex. to her job or home.
Searching by location and age presented on a visual/interactive map.
Joanna needs to be sure that she chose the right place for her children to learn, especially when it comes to the quality of the lessons. She wants to know, what other parents think of the offer.
Let’s give her the possibility to read recommendations and ratings, but also commenting posts of other parents to ask more questions.
She cares about her kids having new friends. She’s also interested in other children experiences and activities that they attend.
Let’s make it possible for her to find her kid’s friends and check out what kind of after-school activities they already have.
Joanna is very busy, she needs to feel in control over the family schedule.
Let’s synchronize her calendar with our product so she would instantly know if the activities chosen are not interfering with another lineup.
Before getting into design, I did some research on the market. I wanted to know how our potential competition looks like, what do they have to offer (in terms of content, design, performance, usability, layout, navigation structure or target market), what could be our x-factor. I also wanted to know some tools that provide solutions for our ideas and compare them (other online platforms that offer features that we need to implement). So I created a base of applications and websites for analysis. Thanks to the previous Visual Thinking session I knew exactly what to look for. I learned that this project has great potential because there’s no online platform like this on the market.


Now was the time to think about the user’s experience. Based on the knowledge gathered, we learned that it would be best if we create something simple, time-saving and safe but also fun and beautiful.
At this point keeping in mind our goals, first, we prepared User Scenario. That let us create a diagram for the user flow. Our ideas were getting more and more precise.

We were ready to draw the first sketches of the product and start to design the user experience.
Joanna enters her question into the search area and gets the result list

She chooses one of the offers, enters the landing page, and then asks a question to other parents commenting.
Then she decides to buy one time class participation.
We wanted to test our ideas as fast as possible but also at the lowest cost.
That’s why we choosed paper prototyping.
We found some issues that the users had during the first iteration, so we made few changes and tested them again.
You can see the test’s report here.
We decided that testing with the paper prototype was accurate and sufficient, so there was no need to duplicate the tests with low-fidelity wireframes.
First of all, we wanted young children and younger teenagers to associate EDUradar with education but also with growth and fun.
We wanted to make a simple and safe place for parents to choose after-school activities for their kids.
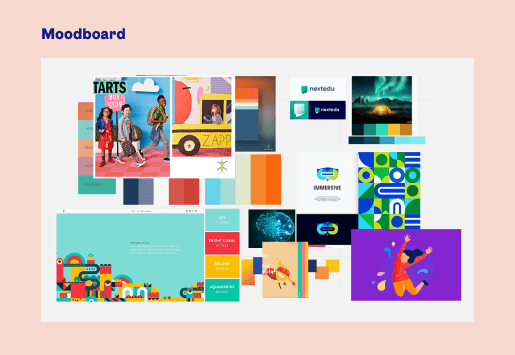
That’s why we choose navy blue, green and orange.
But they can’t be boring!
So we made them vivid to be associated with being active. We wanted them to be attractive and eye-catching for kids and youngsters.
Education
Order
Trust
Motivation
Joy
Excitement
Relax
Growth
Peace
At the same time, we came up with a new name for the platform. Everybody liked the EDUradar name because it was so simple and obvious in a good way, but we wanted something that would bring some warmer feelings.

An owl (“sowa” in polish) is a common symbol of education and wisdom but we wanted the name to be not so serious. We used a diminutive of the name: an owlet (“sówka”), which also means a young owl.
To make it more fun and “cool” we spelt it with English double “o” instead of polish “ó” which in this case sounds almost the same ( “oo” = “ó”).
That’s how EDUradar became SOOWKA.
Besides minor issues, the biggest problem was the calendar for Chess Club - the activity selected by Joanna according to the user’s scenario. It was designed to show both, Joanna’s tasks and the club’s meeting dates simultaneously to save her time. It appeared to be too confusing for the tests participants and they didn’t understand it. As we all know, less is better, and in this case, after the tests, it was obvious that showing only the calendar of the Chess Club will be more reasonable and useful.
This is how the final design looks.

Desktop and mobile prototype presentation
Mobile protoype on a smartphone
